Statistics without the fear
Mean, variance and why sample size matters, with everyday examples.
Published
8 July 2026
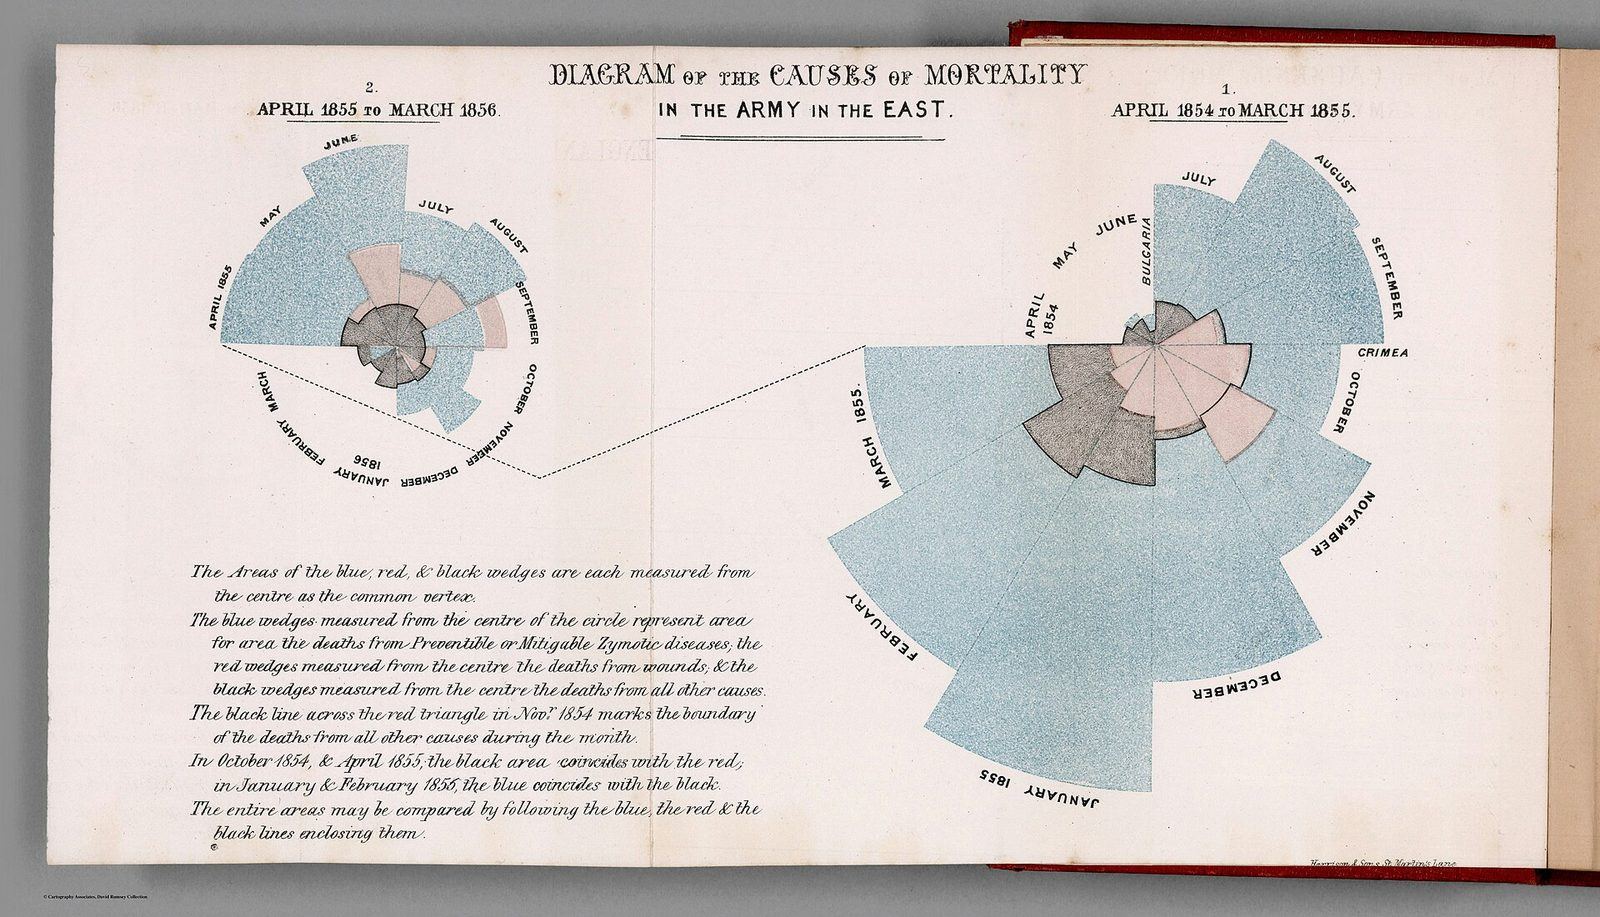
Statistics has a reputation for being hard, and the reputation is partly deserved: the full subject is deep, technical and easy to get wrong. But most of what you need in everyday life comes down to a few ideas, none of which requires more than school arithmetic. They help you read the news, judge whether a study is worth taking seriously, and, most importantly, avoid fooling yourself with your own data. The ideas are also older and more human than the formulas make them look.
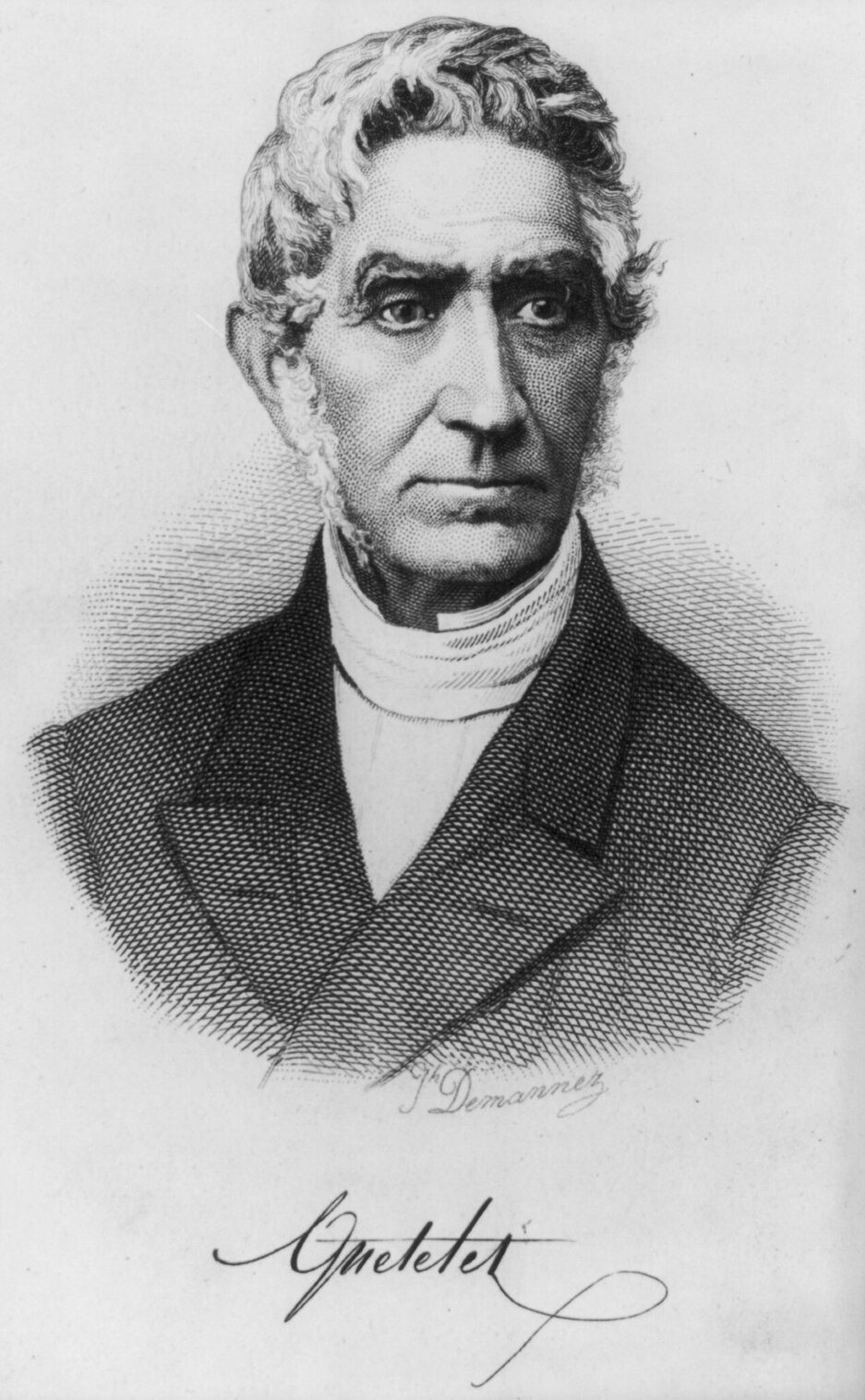
The word itself comes from the state. In the eighteenth century, “statistics” meant the collection of facts about a country, its population, trade and resources, for the use of those who governed it. In the 1830s the Belgian astronomer Adolphe Quetelet began applying the methods astronomers used for measurement errors to human beings. He measured the chests of Scottish soldiers and the heights of French conscripts, found that they clustered around an average in a bell-shaped pattern, and imagined an “average man” as the ideal type around which real people varied. The average man was a strange idea, and Quetelet took it further than it could go, but the tools he popularised are still the first ones anyone needs.
The first of those tools is a way of describing the middle of a set of numbers. The mean is the familiar average: add everything up and divide by how many numbers there are. The median is the middle value once everything is lined up in order. Most of the time they sit close together, and it does not matter much which one you use. They come apart when something extreme appears. Take five people with salaries of 30, 32, 35, 38 and 40 thousand. The mean and the median are both 35 thousand. Now replace the last person with someone who earns a million. The median is still 35 thousand, because the middle person has not changed. The mean jumps to 227 thousand, a number that describes nobody in the group. Whenever you see an average for something with a long tail, such as income, house prices, company sizes or the populations of cities, it is worth asking which kind of average it is.
The middle is only half the story. Two classes can have exactly the same average grade and completely different experiences. In one, everyone scored around 70. In the other, half the class scored 40 and half scored 100. To capture the difference, statisticians measure spread. The variance measures how far values sit from the mean, on average, by squaring each distance from the mean and averaging the squares. Squaring makes every distance positive and gives extra weight to values far from the centre. The standard deviation is the square root of the variance, which puts the measure back into the original units, points, centimetres or currency, so it is easier to interpret. For data shaped like a bell curve, a useful rule of thumb is that about 68 per cent of values fall within one standard deviation of the mean, and about 95 per cent within two.
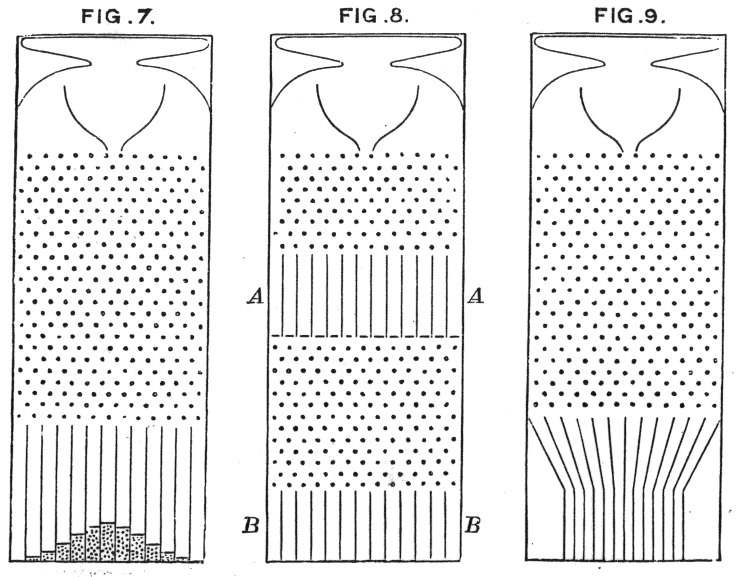
The bell curve itself appears so often for a reason, and the Victorian scientist Francis Galton built a machine to show it. His “quincunx”, described in 1889, was a board studded with rows of pins. Balls dropped in at the top bounced left or right at each pin, at random, and collected in slots at the bottom. Each ball’s path was unpredictable, but together they piled up in a bell shape, high in the middle and low at the edges, every time. Many real quantities behave like this because they are the sum of many small, independent influences, and sums of that kind tend towards the bell curve whatever the influences are.
Galton’s board also shows why sample size matters so much. Flip a fair coin ten times, and getting seven heads is not at all surprising. Flip it a thousand times, and getting seven hundred heads would be extraordinary, strong evidence that the coin is not fair. This is the law of large numbers: as a sample grows, its average settles closer and closer to the true value. How much closer? The uncertainty of an average, called its standard error, shrinks with the square root of the sample size. To halve the uncertainty, you need four times as much data. That is why small studies swing so wildly from one to the next, and why a survey of a thousand people is far more trustworthy than one of fifty, but a survey of four thousand is only twice as precise as one of a thousand, not four times.
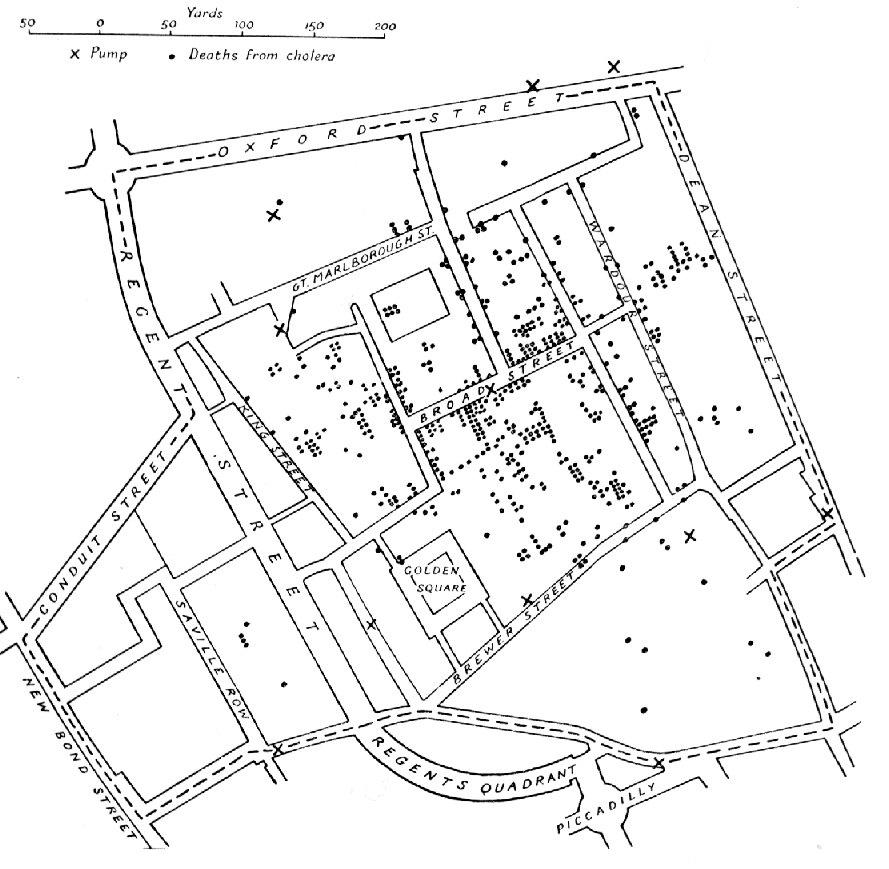
Numbers become most powerful when they are used to answer a question. In 1854 the London physician John Snow marked each death in a cholera outbreak in Soho on a street map, and showed that they clustered around a single water pump on Broad Street. At a time when most doctors believed cholera spread through bad air, his map helped make the case that it was carried in water. It was not sophisticated mathematics. It was careful counting, a clear comparison and a willingness to follow the evidence.
For everyday use, three questions do most of the work, and you do not need any formulas to ask them. The first is “compared to what?” A 20 per cent rise means little without knowing the starting point, and a risk that has doubled may still be tiny. The second is “how many?” A striking result from twelve people deserves much less trust than a dull result from twelve thousand. The third is “could it be chance?” If you run enough comparisons, some will look impressive by luck alone, the same way that someone, somewhere, will flip ten heads in a row. Asking these questions is a habit more than a skill, and it is the most useful habit statistics has to offer.
Next in the series: Writing clear sentences.
Ayoub Khallok keeps this archive of essays, research, lessons and notes, written to understand things more clearly. More about Ayoub.