Reading a balance sheet in ten minutes
Assets, liabilities and equity, and the three questions to ask of any company.
Published
1 September 2026
A balance sheet is a photograph of a company on a single day. It lists what the business owns, what it owes, and what is left over for its owners. It looks intimidating the first time, a long column of numbers with unfamiliar names, but it is built on one idea that has not changed in more than five hundred years. Once you understand that idea and the way the page is laid out, you can read a balance sheet in about ten minutes and come away knowing whether a company is sturdy or fragile.
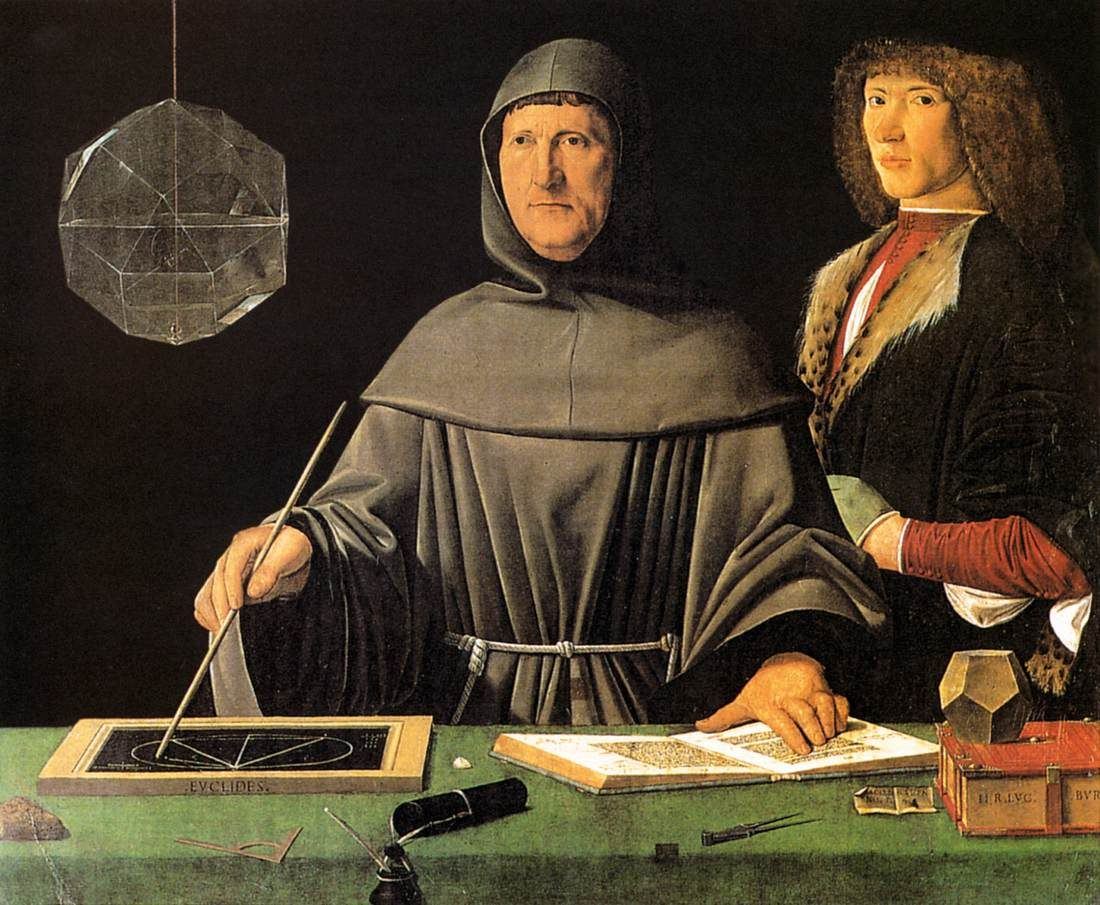
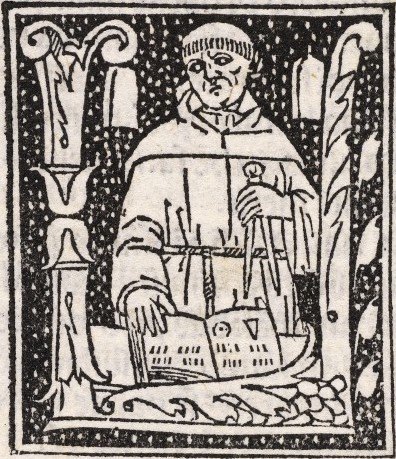
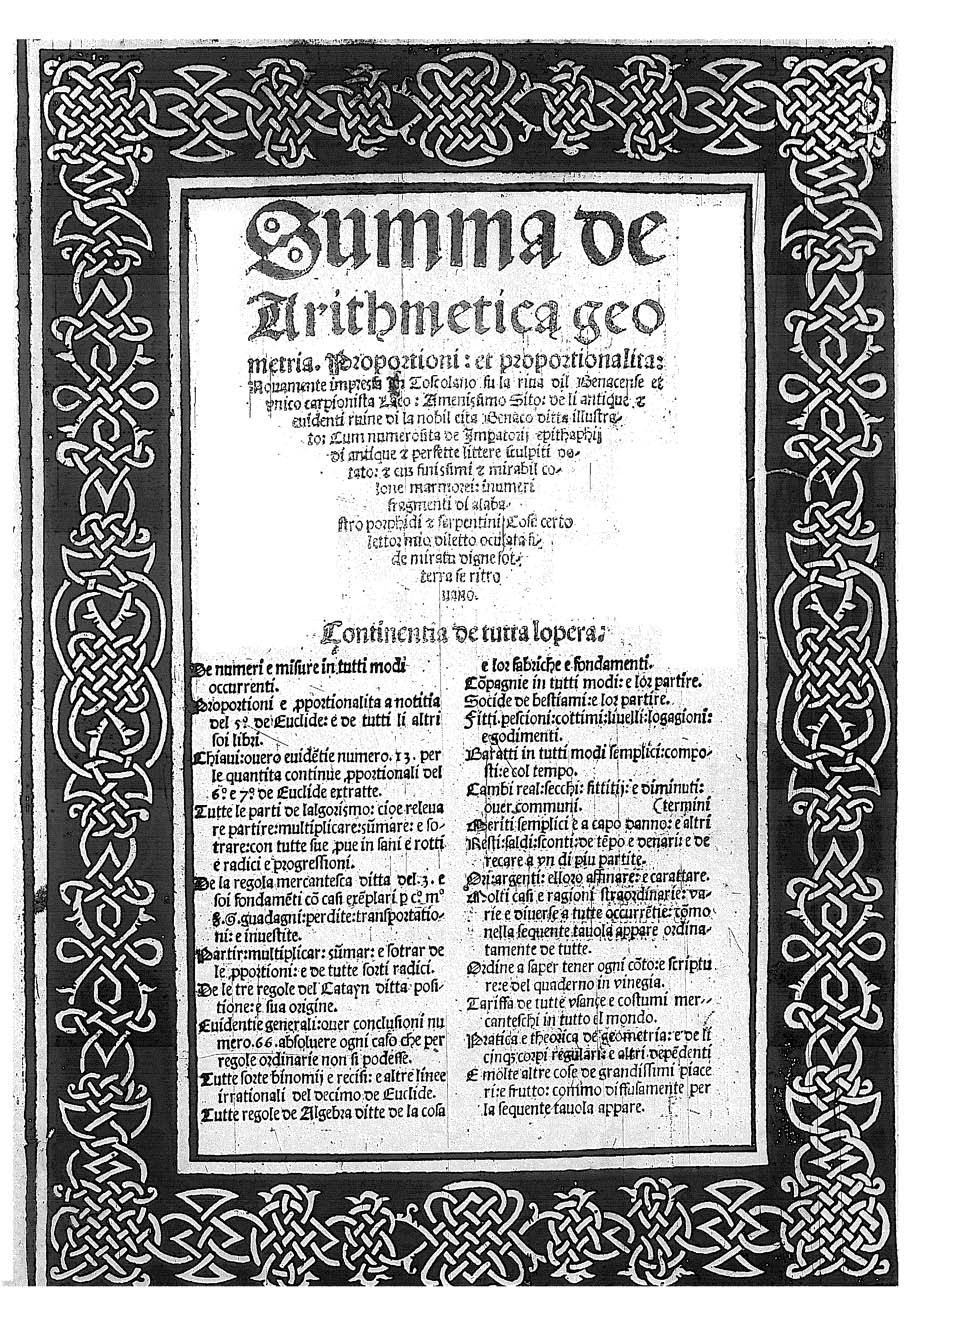
The idea is double-entry bookkeeping. Merchants in the Italian trading cities were using it by the fourteenth century, and in 1494 the Franciscan friar and mathematician Luca Pacioli published the first full printed description of it, in a section of his great textbook Summa de arithmetica. He called it the method of Venice. Every transaction is recorded twice, once as a debit and once as a credit, so that the books always balance. If a business borrows 1,000, its cash goes up by 1,000 and its debts go up by 1,000. If it spends 300 of that cash on equipment, cash goes down and equipment goes up. The totals stay equal. Pacioli’s advice was practical and blunt: a merchant should not go to bed at night until the debits equalled the credits.
The balance sheet is the summary of all that bookkeeping on one date, and it obeys a single equation: assets equal liabilities plus equity. Assets are everything the company controls that should bring in money later: cash, money customers still owe, inventory, buildings, machines, patents and software. Liabilities are what it owes to others: suppliers waiting to be paid, lenders, employees, the tax authorities. Equity is the difference, the part of the assets that belongs to the shareholders once every debt has been settled. The two sides always balance because equity is defined as whatever is left. If the value of the assets falls while the debts stay the same, equity shrinks. That is why losses eat into equity first, and why a company with thin equity has little room for bad years.
Both sides of the balance sheet are also divided by time. Current assets are those expected to turn into cash within a year: cash itself, receivables from customers, and inventory. Non-current assets last longer: property, equipment, patents, and goodwill, which is the amount paid for past acquisitions above the value of the assets acquired. In the same way, current liabilities are due within a year, such as supplier bills, short-term loans and wages owed, while non-current liabilities are due later, such as long-term debt, leases and pension obligations. This division matters more than almost any single number on the page. Companies rarely fail just because they are unprofitable for a while. They fail when bills come due before the cash to pay them arrives.
A small example makes it concrete. Imagine a bakery at the end of its financial year.
| Assets | Liabilities and equity | ||
|---|---|---|---|
| Cash | 20,000 | Supplier bills | 15,000 |
| Flour and stock | 10,000 | Bank loan, due in 5 years | 60,000 |
| Ovens and fit-out | 90,000 | Equity | 45,000 |
| Total | 120,000 | Total | 120,000 |
The owners have 45,000 of their own value in a business holding 120,000 of assets. The rest has been borrowed, from the bank and, for a few weeks, from the suppliers.
With the page laid out like this, three questions do most of the work. The first is whether the company can pay its bills. Compare current assets with current liabilities. The bakery has 30,000 of current assets, its cash plus its stock, against 15,000 of current liabilities, which gives a current ratio of 2. A ratio comfortably above 1 means that short-term obligations are covered by assets that will turn into cash in time. A ratio well below 1 is a warning sign, unless the business collects cash very quickly, as supermarkets do, selling their stock for cash long before they pay their suppliers.
The second question is how much the company relies on debt. Divide total liabilities by equity. The bakery owes 75,000 against 45,000 of equity, about 1.7 times. Debt is not bad in itself. It lets a business grow faster than its owners’ money alone would allow, and interest on it is often tax-deductible. But debt brings fixed payments that do not shrink in a bad year, and the more of it there is, the less room there is for things to go wrong.
The third question is what the equity is really made of. Look at which assets are holding it up. Cash and receivables are close to real money. Equipment can usually be sold, though often for less than its value on the books. Goodwill and other intangible assets depend on assumptions about the future, and they can disappear quickly. A company whose equity consists mostly of goodwill from past acquisitions can see that equity vanish with a single write-down, if the businesses it bought turn out to be worth less than it paid.
A few habits make reading balance sheets much more useful. Always read two of them, a year apart, rather than one. A single balance sheet tells you where a company stands. The changes between two tell you which direction it is moving in: whether debt is rising, whether cash is draining away, whether receivables are growing faster than the business. Read the notes, too. Leases, pension promises, lawsuits and other commitments are often described there in more detail than on the face of the statement. And remember that the balance sheet shows one day. A retailer’s balance sheet looks very different in January, after the holiday sales have turned stock into cash, than it does in November, when the warehouses are full.
Next in the series: Reading an income statement, which shows how the company performed between two balance sheets.
Ayoub Khallok keeps this archive of essays, research, lessons and notes, written to understand things more clearly. More about Ayoub.